Platform Overview
Every way you can access, visualize, and act on your interference data.
Completely Free
Coverage heatmap
WebGL-rendered HEALPix mesh with orthographic projection. Scrub through 10,080 epochs to see exactly when and where interference appears. 50,000+ cells at 60fps.
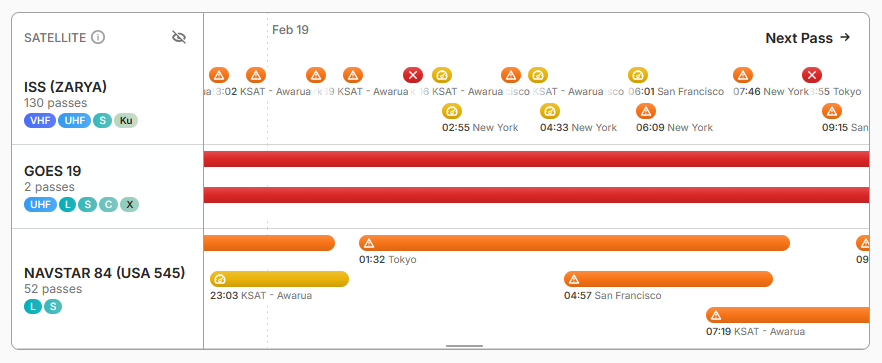
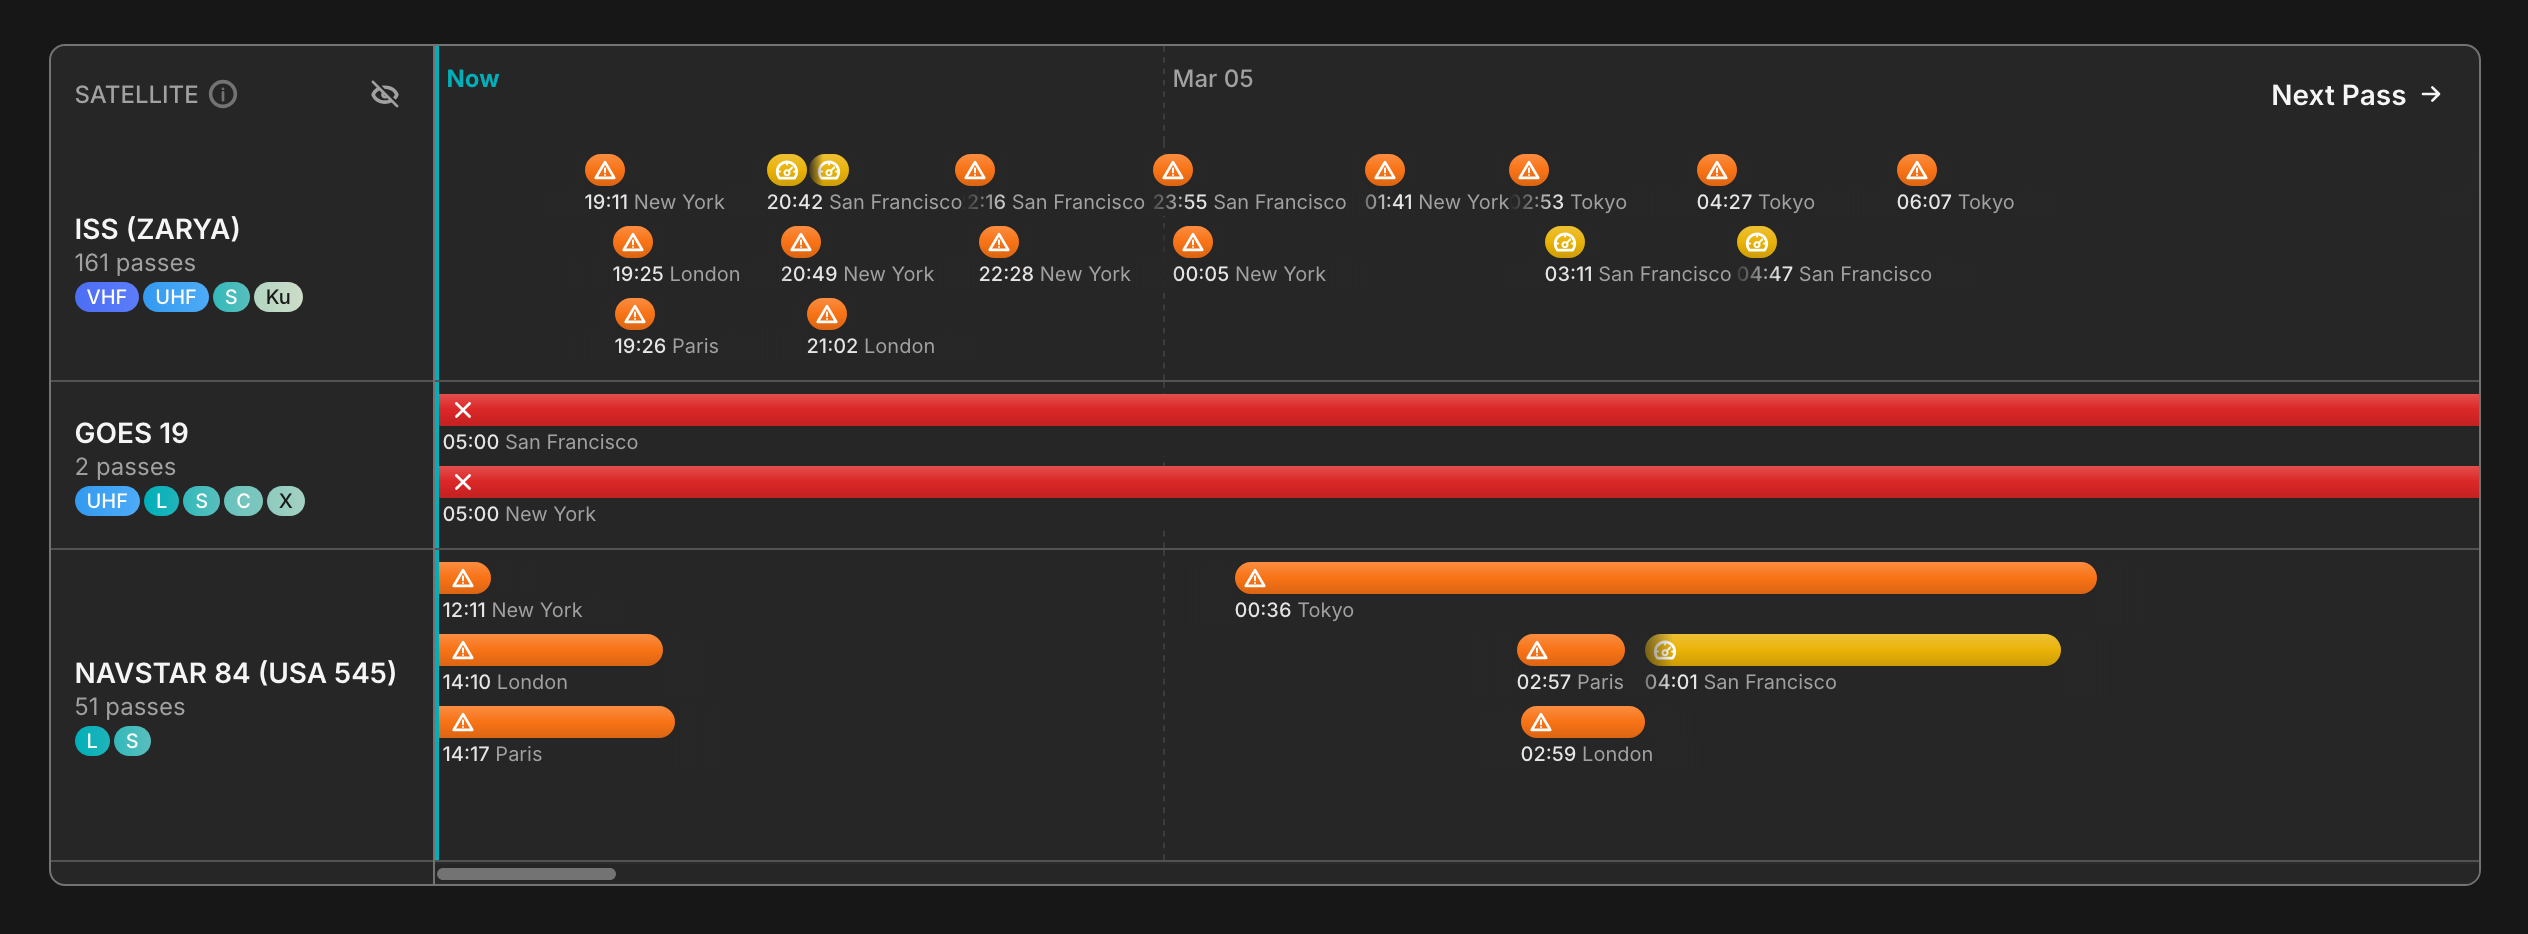
Pass scheduler
Gantt-style dashboard showing satellite passes across a 7-day window with interference overlays, ground station visibility, and per-pass frequency band detail.
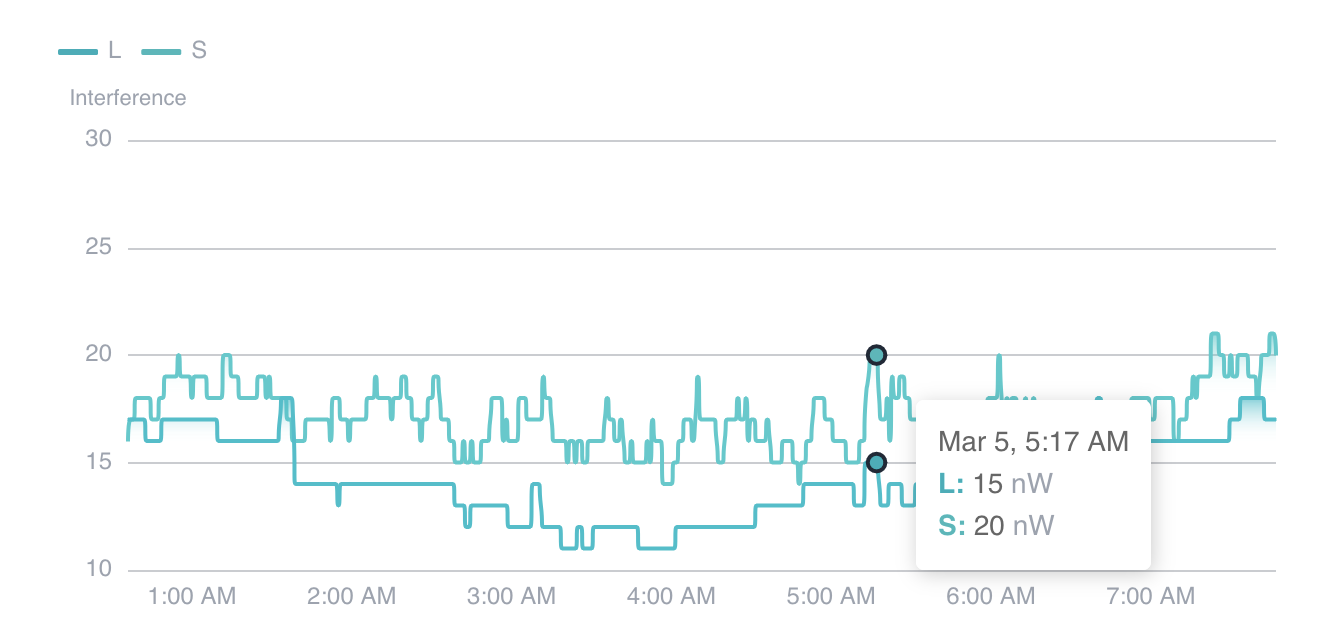
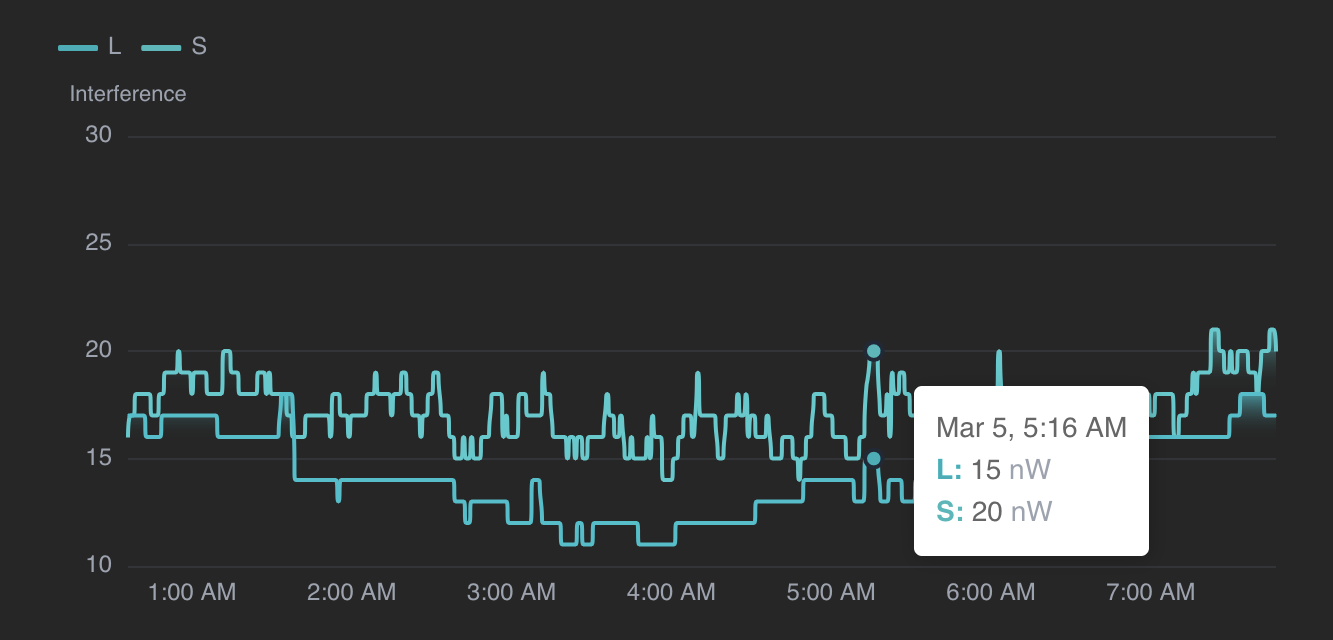
Interference timeline
Time-series charts showing max and average interference levels across the full 7-day window. LTTB-sampled for responsiveness on large datasets.
Reporting & Export
Pull the data you need in the format that fits your workflow.
Analytics export
Export analysis results as JSON or CSV — intensity distributions, temporal analysis, coverage gaps, interference events, and satellite overlap periods. Cached for fast repeat access.
Board-ready visuals
Clean, presentation-quality heatmaps and charts that communicate forecast implications at a glance. No post-processing needed — screenshot or export directly.
Notifications & Alerts
Stay ahead of interference events without watching a dashboard.
- In-app notifications — Real-time alerts in your notification center with read/unread tracking
- Email alerts — Scheduled digests and critical interference event notifications
- Push notifications — Mobile and desktop alerts for time-sensitive events
- Automated analysis — Daily 7-day forecasts run automatically for all tracked satellites
API Access
Everything in the UI is available programmatically. Integrate Vega into your existing ground systems, NMS, or internal tools.
REST API
Query interference at any point, time, and frequency band. Time-series endpoints for ground station monitoring. Batch propagation for high-throughput analysis.
Token management
Create, rotate, and revoke API tokens from the dashboard. Scoped access per token with expiration reminders.
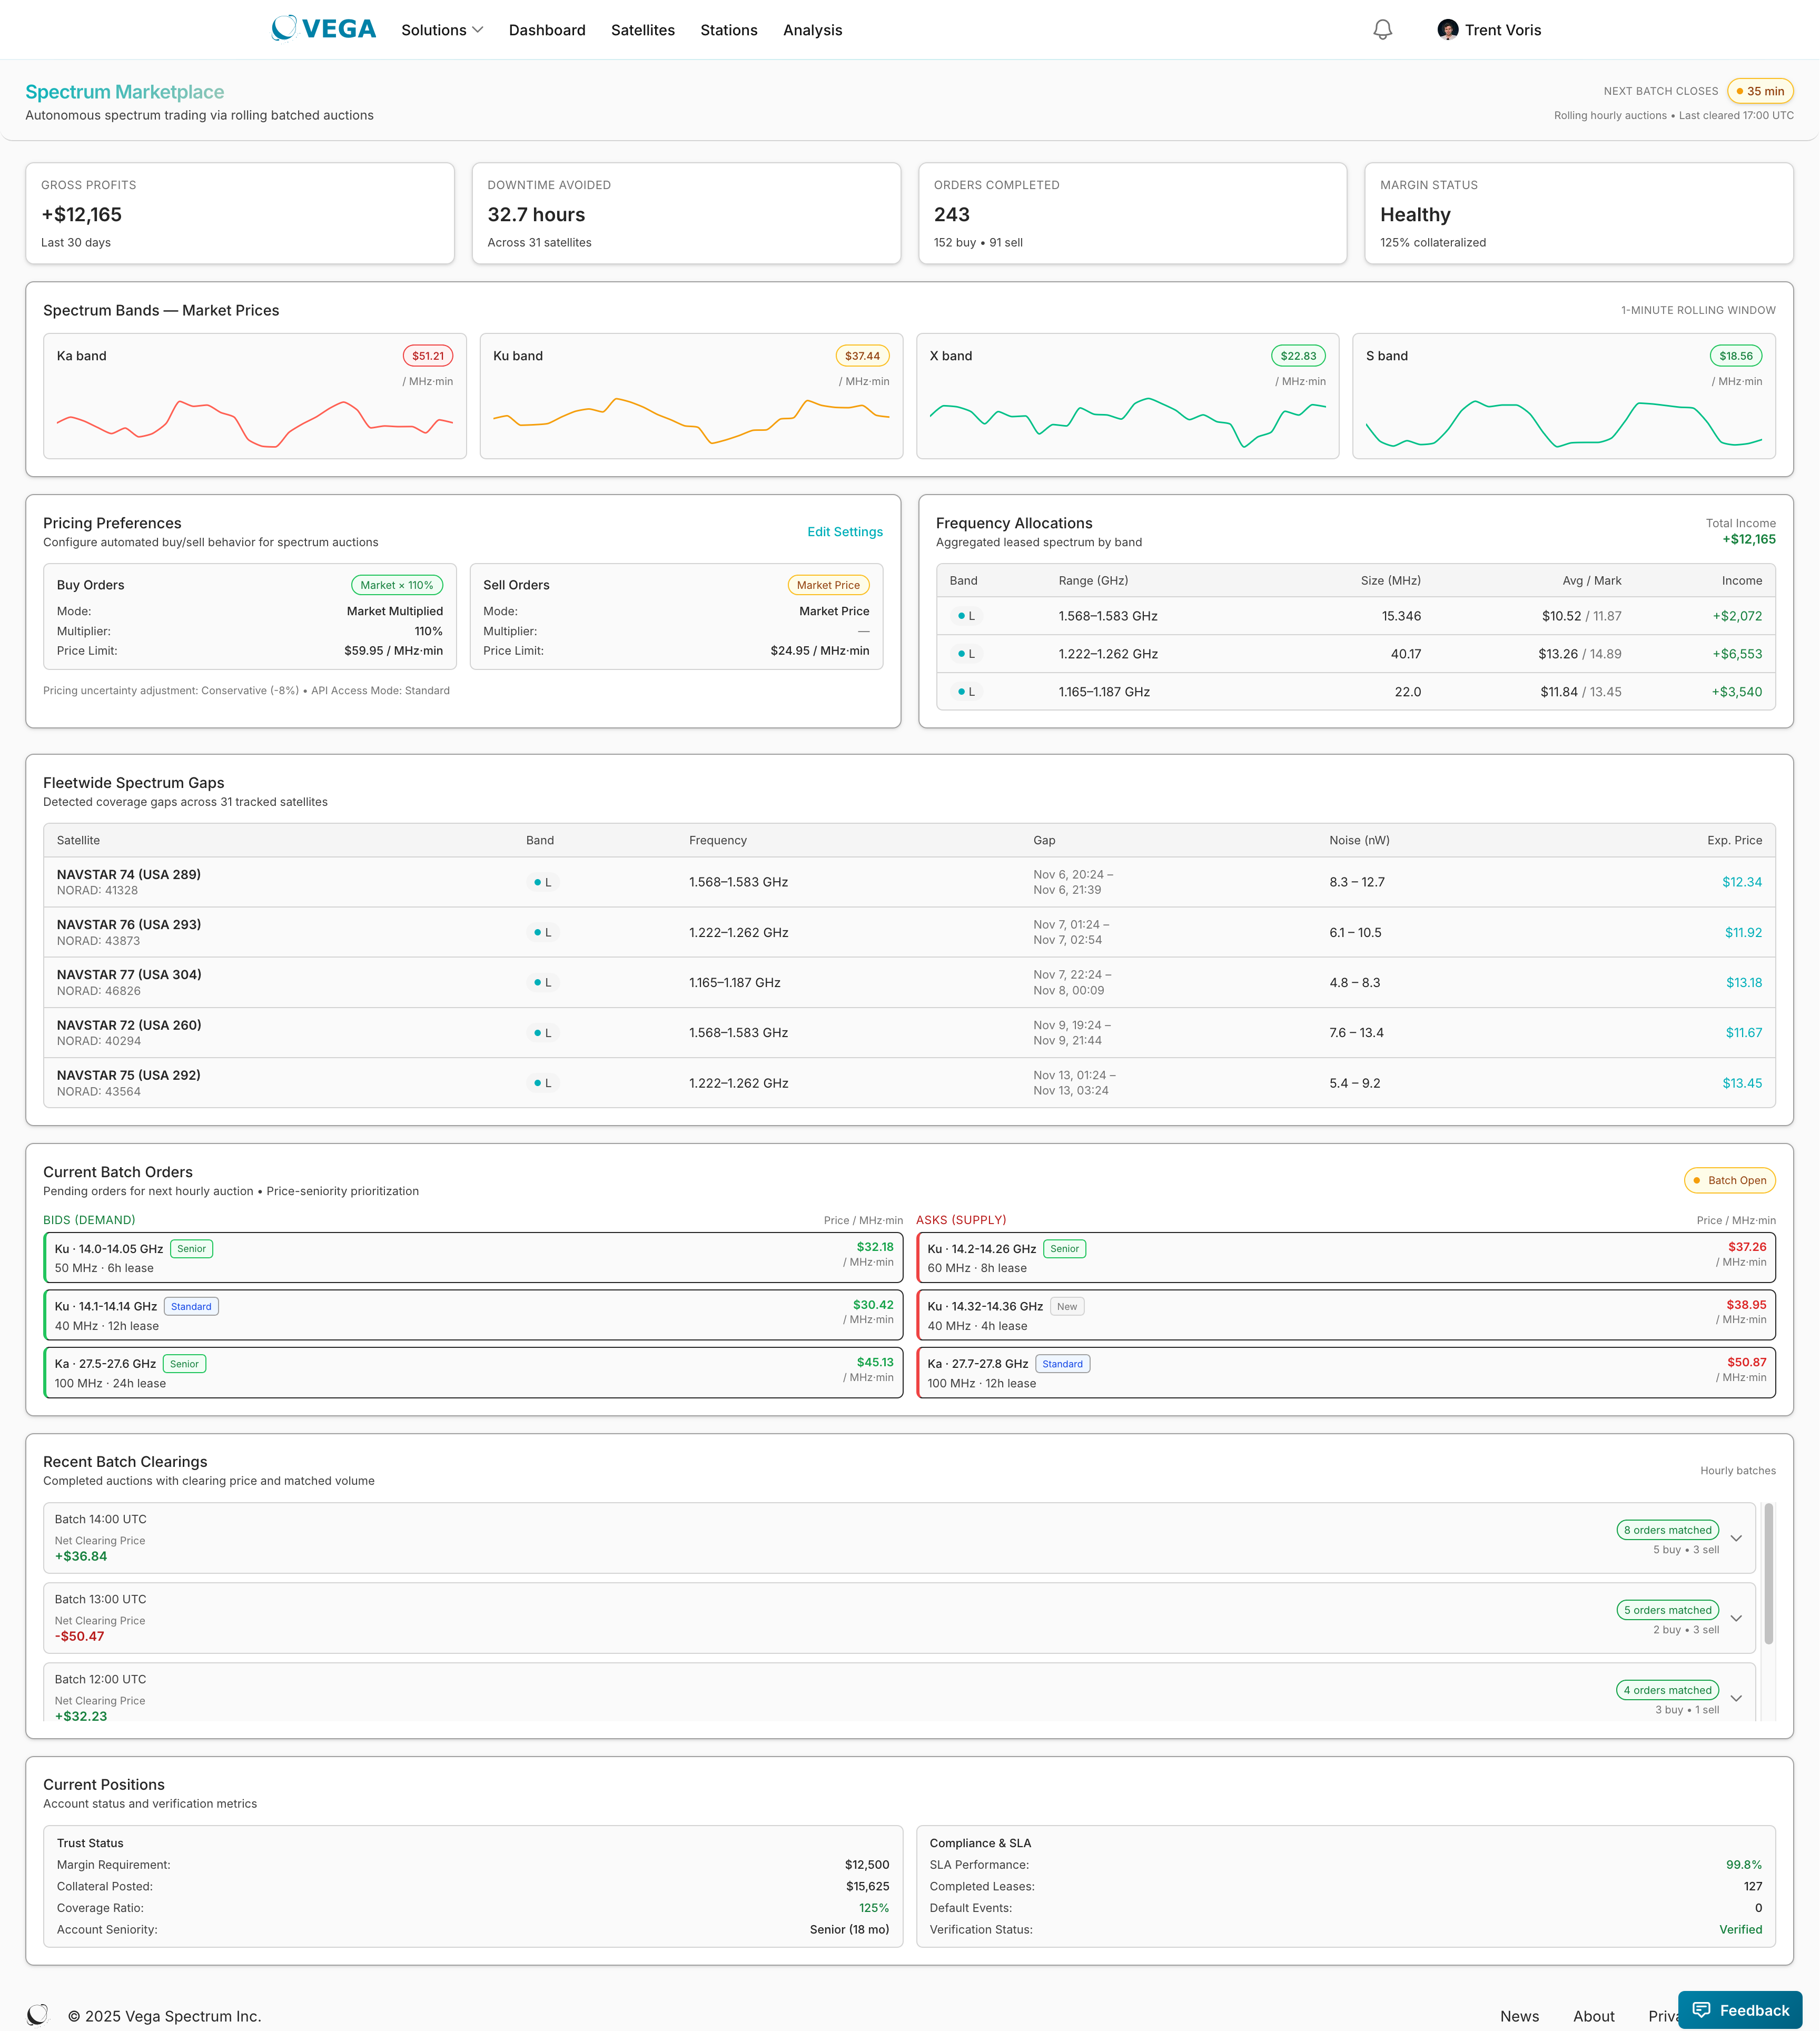
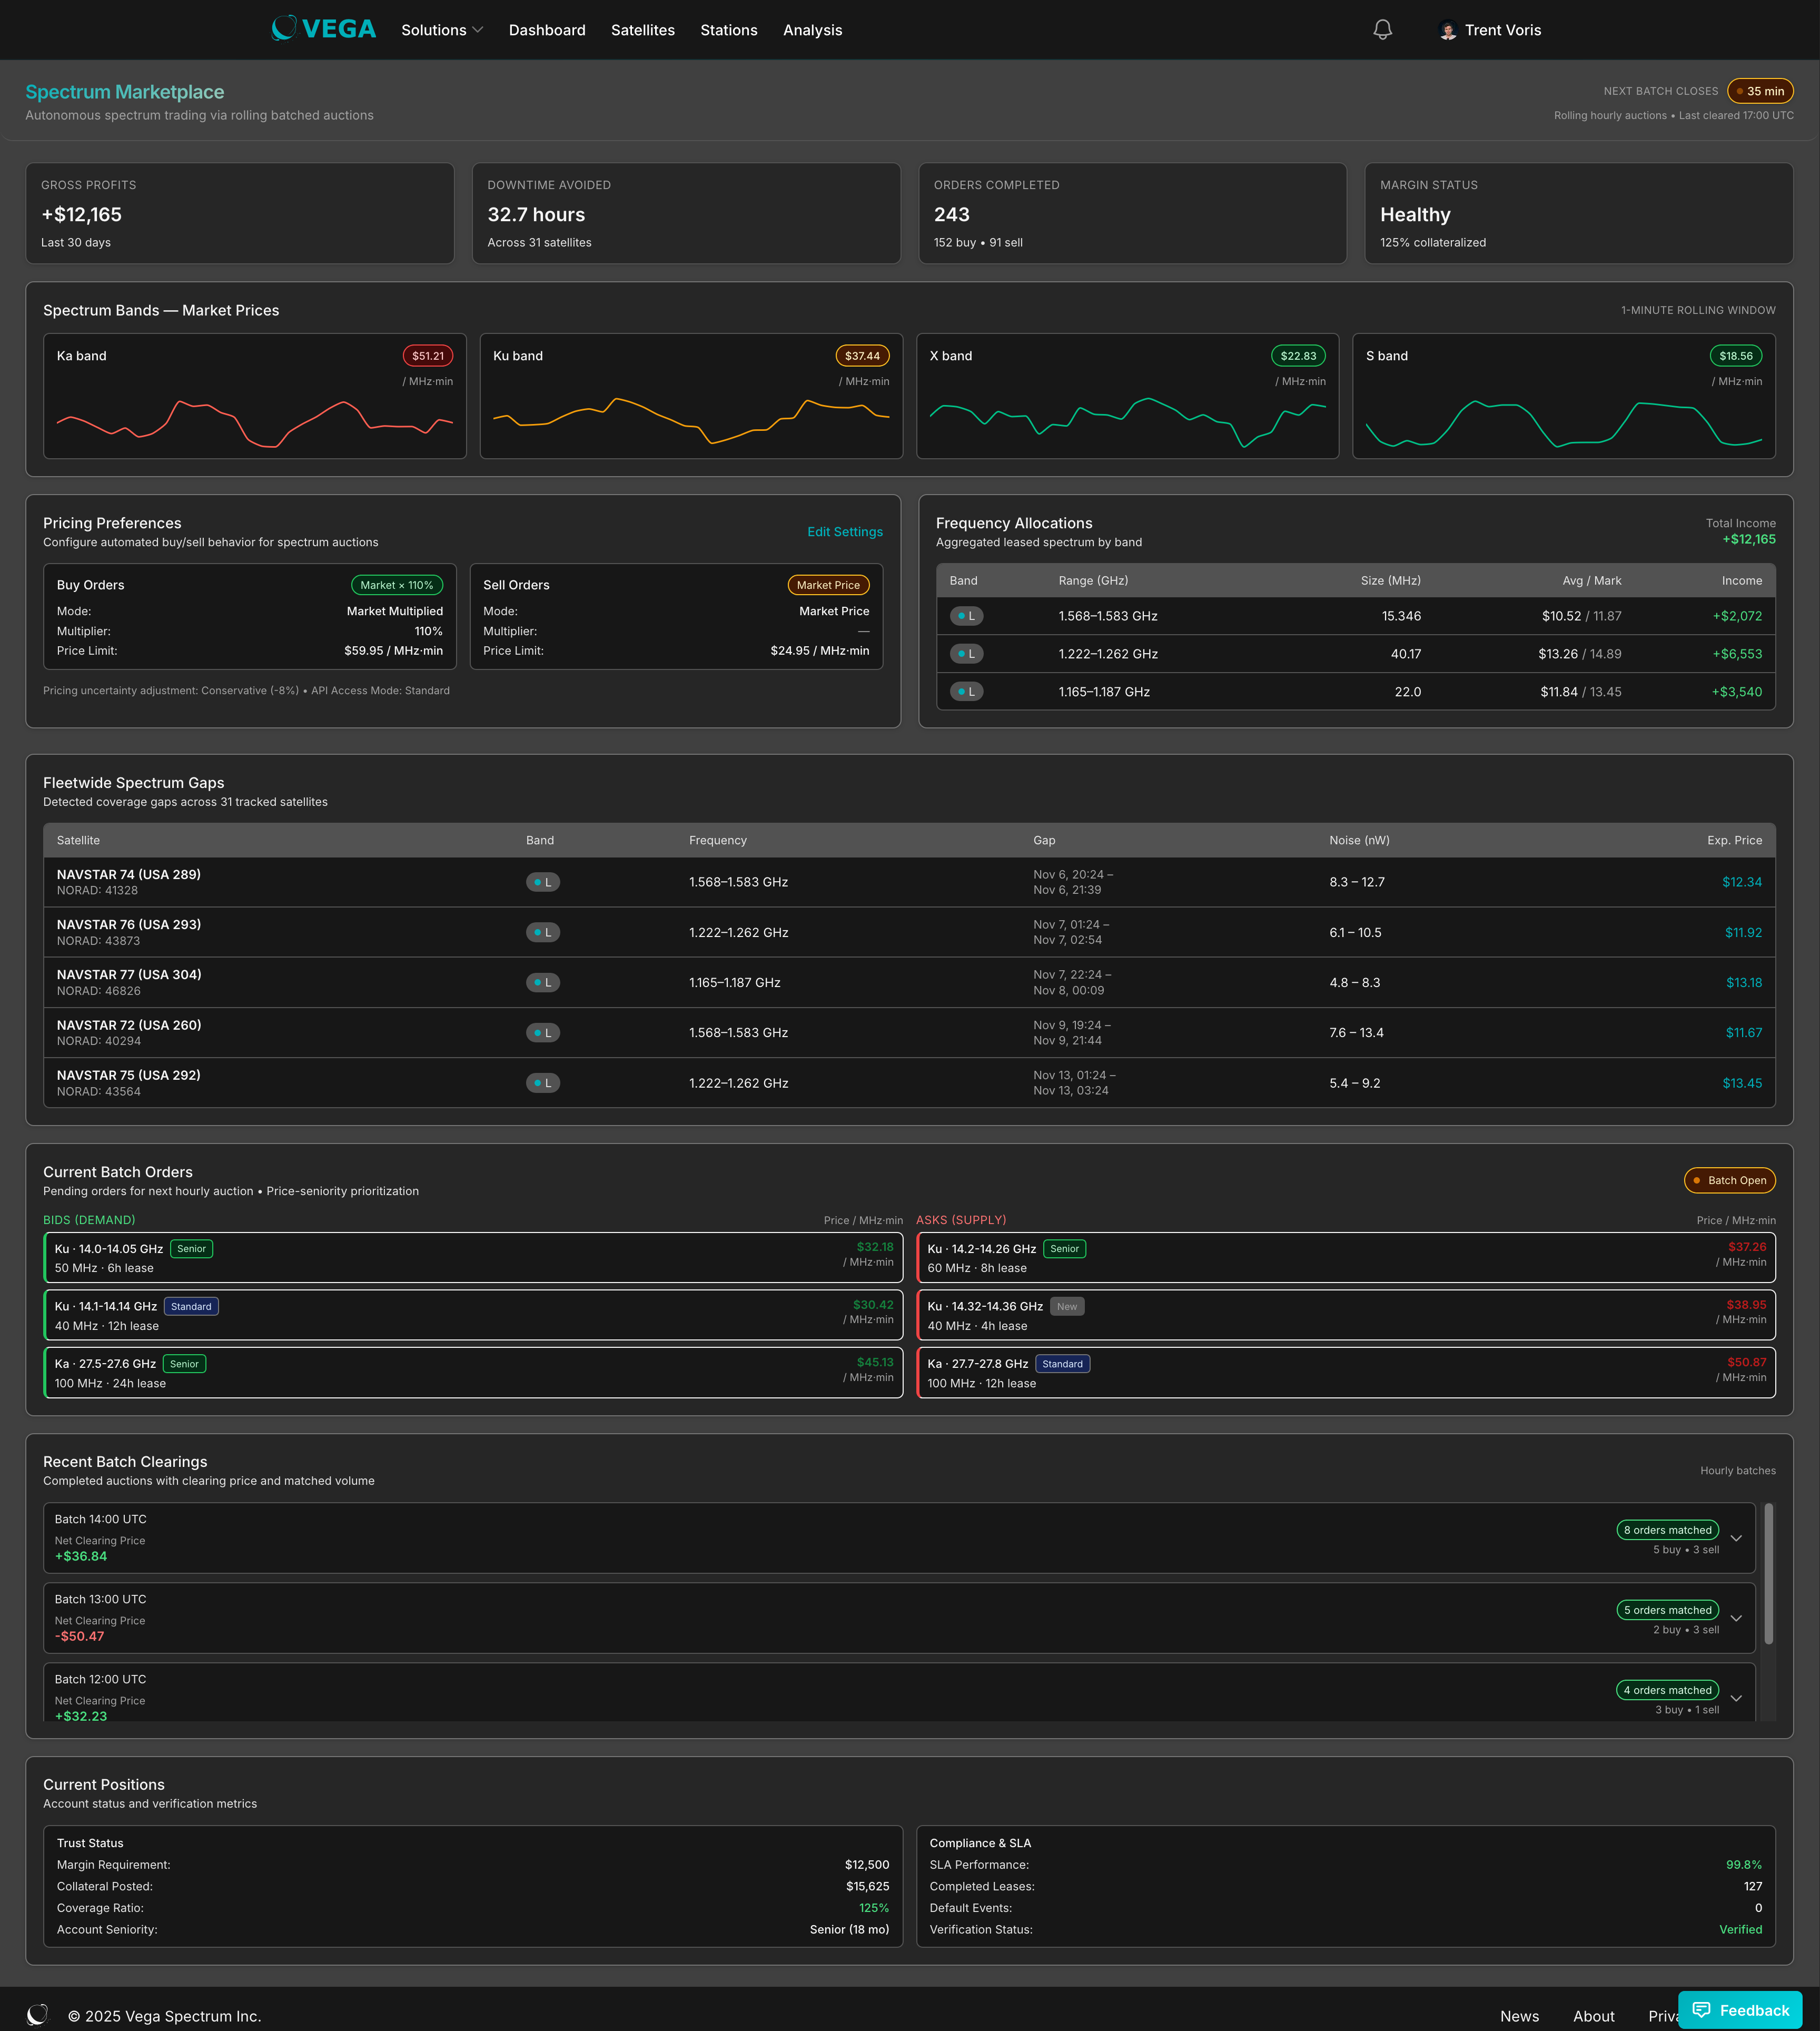
Spectrum Marketplace
Dynamic spectrum allocation and automated trading — coming soon.
Feedback & Support
We build in public and prioritize based on what operators actually need.
- In-app feedback — Submit bug reports, feature requests, billing questions, or security concerns from any page
- Direct support — Every submission is reviewed by the engineering team, not routed to a call center
- Responsible disclosure — Security issues handled with 24–48 hour acknowledgment and researcher credit
See Vega in action
Fast and free