Elara-AI Foundation
Learning from real-world observations to improve interference forecasting.
Why It Matters
Our interference forecasting relies on physics-based simulation: orbital mechanics (TLE propagation), frequency allocations, and geometric visibility. While accurate, this cannot capture real-world transmission behavior—satellites don't broadcast uniformly across their coverage footprint, they don't have perfect hardware, and they don't behave as expected.
By ingesting real-world observations, correlating them what is possible, and learning from the results, we build models that predict actual transmission behavior rather than just theoretical visibility.
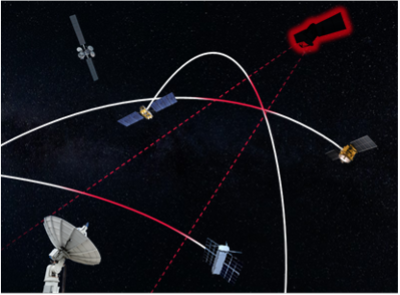
Confidence Tracking
Even if it's your satellite, every day carries inherent uncertainty. Elara-AI tracks this uncertainty through confidence scores across three major dimensions:
- Ephemerides — Projecting TLEs into the future increases positional errors over time
- Pattern of Life — Whether a satellite is actively transmitting and where it is pointing is estimated by a model trained on observed behavior
- Intensity — EIRP levels and signal parameters vary between bands and satellites, affecting signal strength predictions
![]()
How It Works
The Elara-AI pipeline flows through five stages—from raw RF observation to improved forecasts and anomaly alerts.
1 Ground Truth Attribution
Determine which satellite(s) could have produced each observed RF signal. Two modes of operation:
Station-Focused — For known ground station locations with time-windowed observations, propagate all satellite TLEs through the time window, compute visibility for each satellite, and filter by frequency allocation overlap to produce a ranked list of candidate satellites with pass geometry and frequency match confidence.
Forecast-Focused — For validating existing coverage forecasts, compare predicted interference cells against actual observations to identify false positives and false negatives, compute spatial and temporal correlation, and surface systematic bias patterns.
2 Signal Analysis & Likelihood Scoring
Process raw RF observations into clean signals with satellite attribution scores.

Starting from raw radiofrequency readings, the pipeline runs through three steps:
A. Signal Detection — Background subtraction, S-curve detection (Doppler signatures), and parameter extraction: timing, curvature, slope, and center frequency
B. Feature Extraction — Doppler curve shape estimates orbital altitude, signal bandwidth hints at modulation type, and signal strength profiles reveal antenna patterns
C. Likelihood Scoring — For each candidate satellite, combine Doppler curve match, frequency allocation match, historical transmission pattern, orbital geometry consistency, and beam coverage into a combined likelihood score
3 Machine Learning Training
Learn two distinct models from attributed observations. Training data from the previous stages includes satellite ID, geographic cell, time features, observation confidence, pass geometry, frequency band, and measured signal strength.
The models learn to output two variables:
Transmission likelihood:  P(transmit | satellite, location, time, frequency)
Expected power:           E(power | satellite, band, beam, operational_mode)
Transmission likelihood corrects the physics model's geometric assumptions by learning actual beam behavior, operational patterns, and duty cycles—capturing the reality that satellites don't broadcast uniformly across their coverage footprint. This process takes into consideration a whole host of external variables as well:
- Terrestrial Factors - country, nearby stations and population centers, etc.
- Operational Factors - operator, mission type, orbital regime, etc.
Expected power learns actual EIRP levels per band, beam, and operational mode—because intensity varies significantly between satellites and configurations, and the physics model has no way to know this without real-world observations. This takes into consideration numerous parameters as well:
- Hardware Factors - manufaturer, satellite bus, known hardware on board, etc.
- Temporal Factors - launch year, orbital regime, solar flux, etc.
Customer-furnished data improves both models over time. Ground readings and Doppler matching further feed Machine Learning (ML) training datasets. Each new piece of telemetry enhances forecasting and anomaly detection for the entire network by helping to classify these 3rd party vehicles.
4 Enhanced Forecasting
Combine physics-based coverage with learned transmission likelihood and expected power.
Current (Physics Only):
interference_score = visibility × frequency_overlap × geometric_factor
Enhanced (With ML):
interference_score = physics_baseline × ML_transmission_likelihood × ML_expected_power
Where physics_baseline = visibility × frequency_overlap × geometric_factor is the uncorrected simulation. The two ML terms refine it toward reality with one predicting whether a satellite is actively interfering, the other predicting how much power it contributes when it does.
5 Anomaly Detection
Identify unexpected RF activity that doesn't match any known satellite.
- Unattributed Signals — Strong signal detected with no matching satellite candidate, potentially indicating unlicensed transmitters or new satellites
- Hotspot Discrepancies — Predicted vs observed mismatch, potentially indicating model error or beam pattern changes
- Behavioral Anomalies — Satellite transmitting outside its normal pattern, potentially indicating malfunction or intentional operational change
Anomalies trigger alerts; confirmed observations feed back into the training pipeline and allow us to better provide Space Domain Awareness.