Spectrum Forecasting
Predict when and where spectrum congestion will impact your link up to 7 days in advance.
What It Does
Vega forecasts band-specific satellite co-visibility density across the globe for your frequencies and translate it into a congestion risk index, allowing you to:
- Identify high-risk downlink windows
- Prioritize lower-congestion passes
- Adjust modulation or coding schemes proactively
- Re-route traffic across ground assets
Note: Co-visibility is a statistical proxy, but elevated density strongly correlates with noise floor excursions in shared bands.
How It Works

Step 1: Orbital Propagation
Every forecast starts with accurate orbital data. We pull Two-Line Element (TLE) sets from authoritative sources daily and propagate all active satellites and their fields of regard out seven days using industry-standard orbital mechanics—accounting for atmospheric drag, zonal harmonics (J2), and solar radiation pressure.
Step 2: Frequency Conflict Identification
Not all satellites interfere with each other—only those operating in overlapping frequency bands. We map satellites to their frequency allocations using regulatory databases and public filings, then cross-reference to identify which satellites share spectrum with your tracked assets. Only confirmed frequency overlaps or recorded usages are flagged as potential interferers.
Step 3: Coverage Analysis
For each potential interferer, we calculate ground coverage footprints:
- Field of Regard Cones — Each satellite's entire field of regard is modeled as a cone projecting tangent to Earth's surface
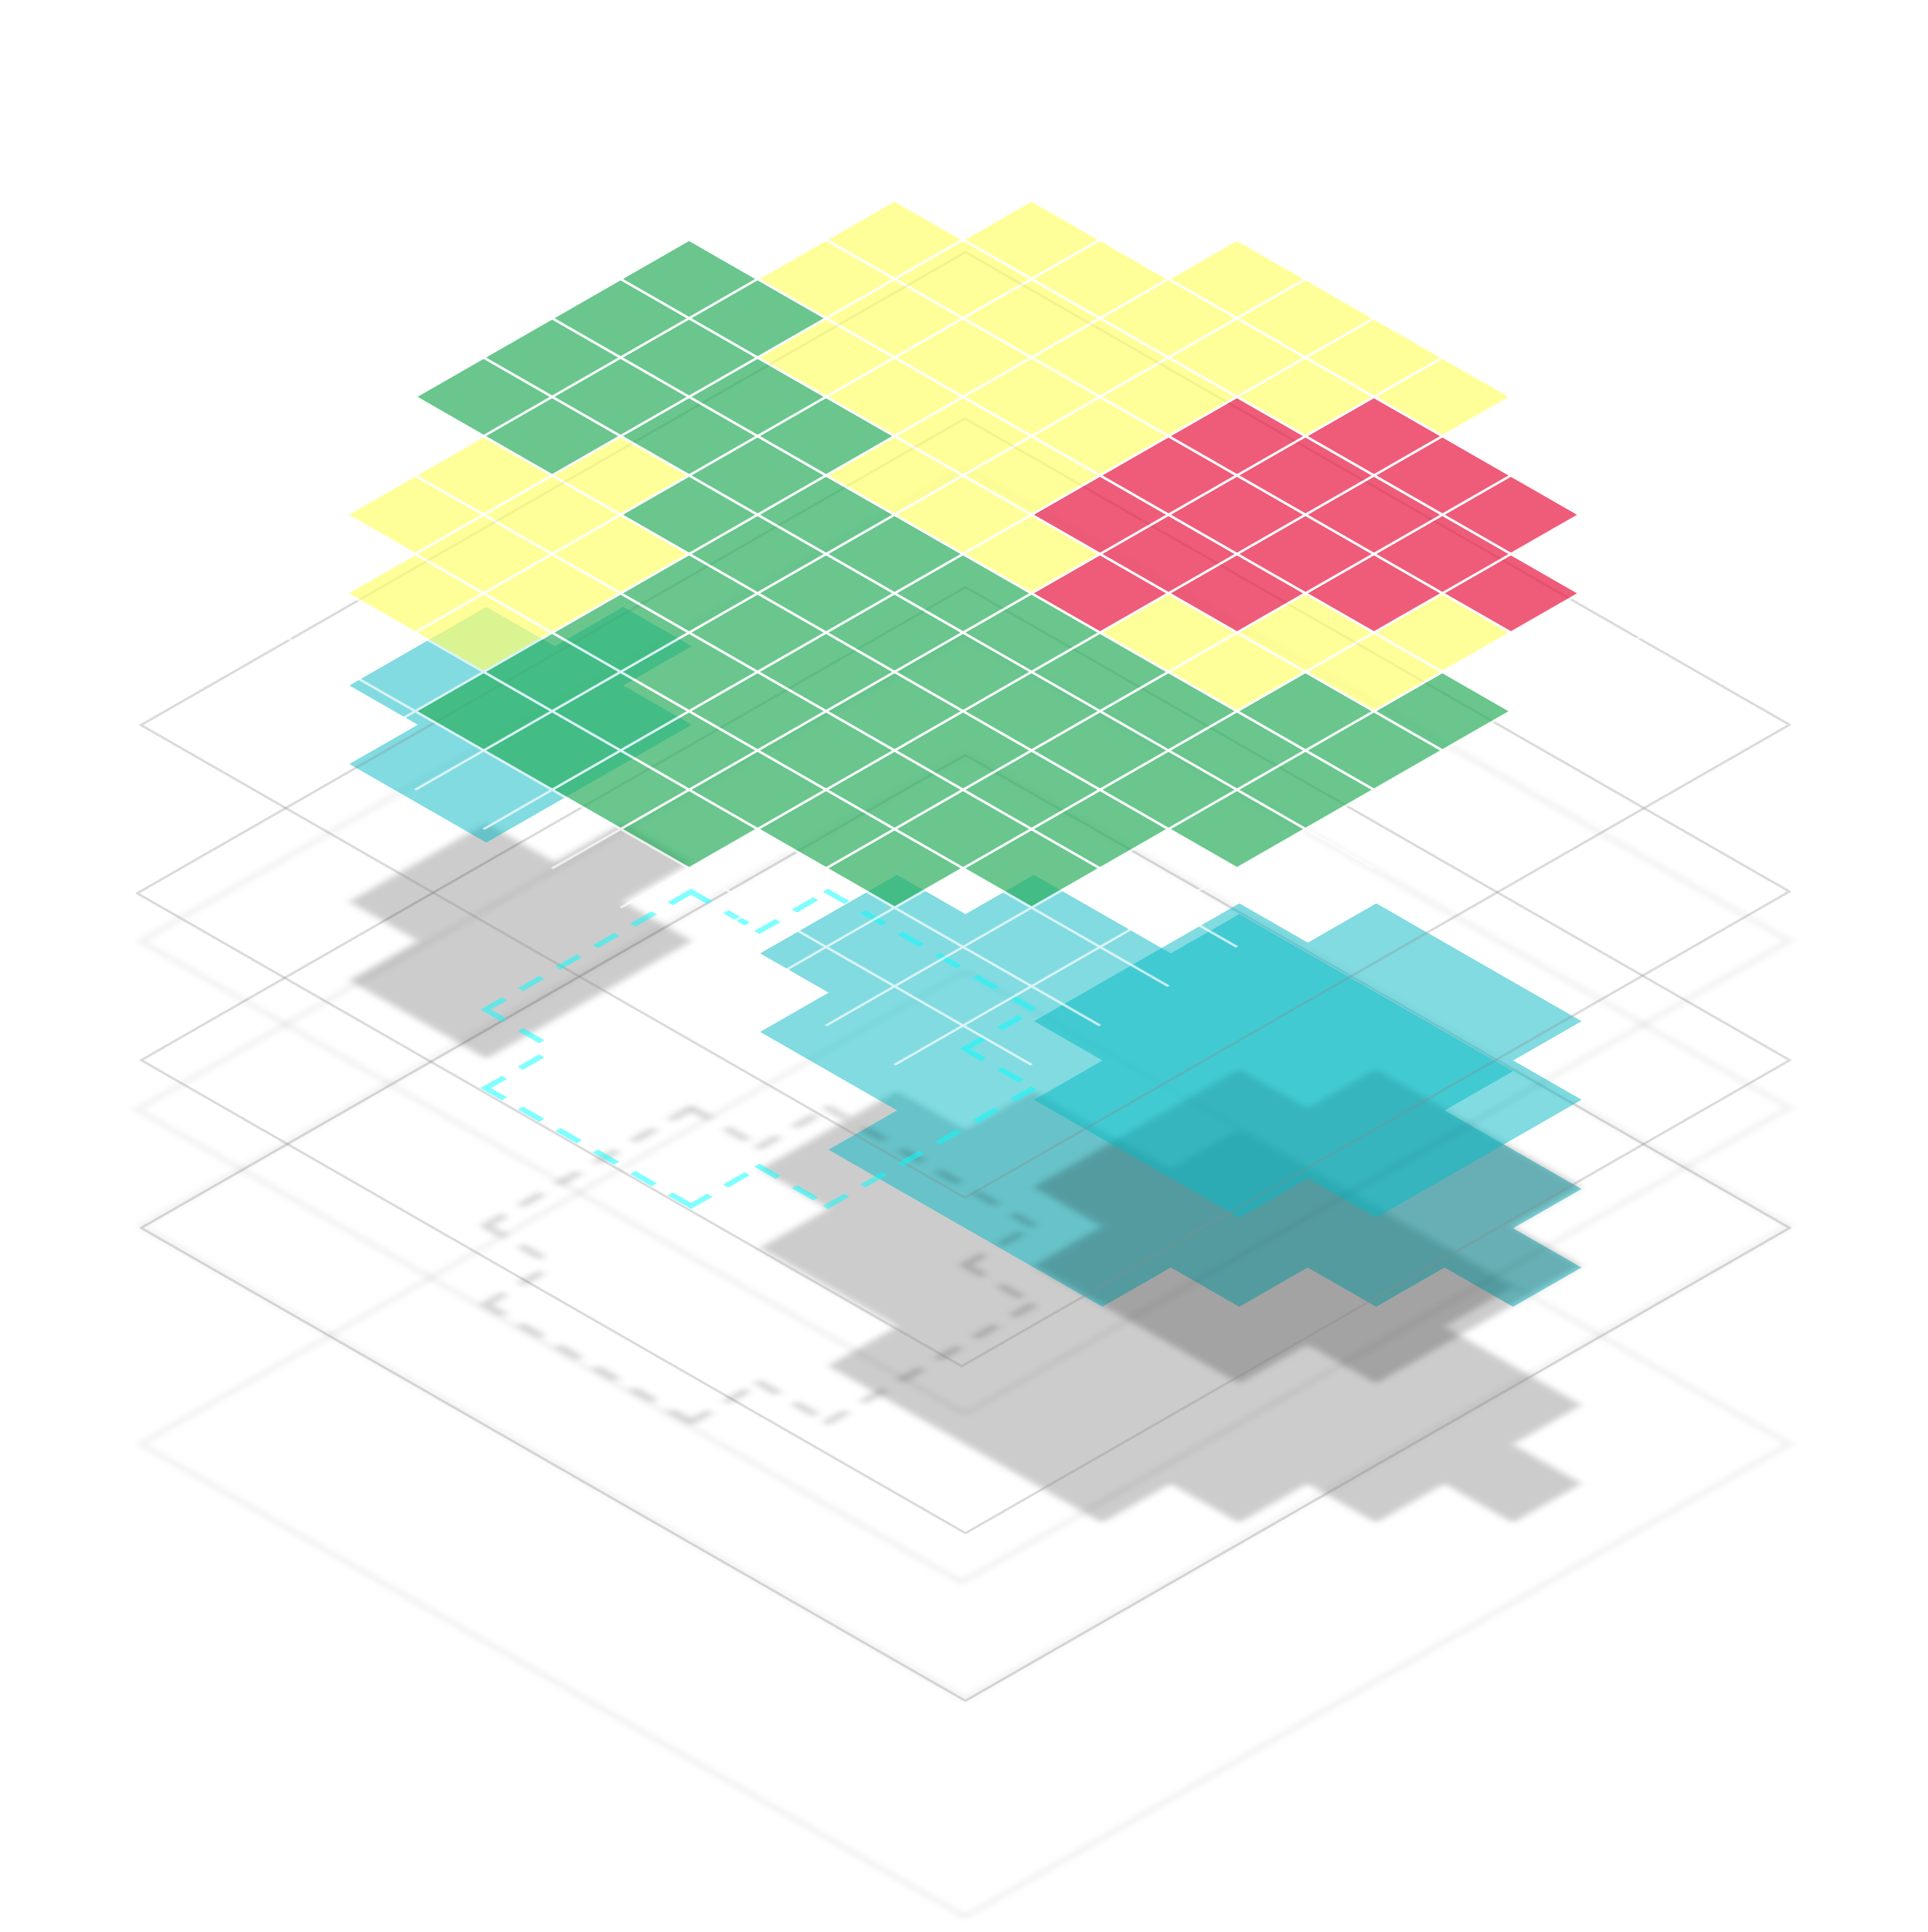
- Geospatial Tessellation — Earth's surface is divided into equal-area cells using a nested HEALPix process that enables flexible resolution
- Timestep Analysis — Coverage is computed for every minute over seven days—10,080 epochs per analysis
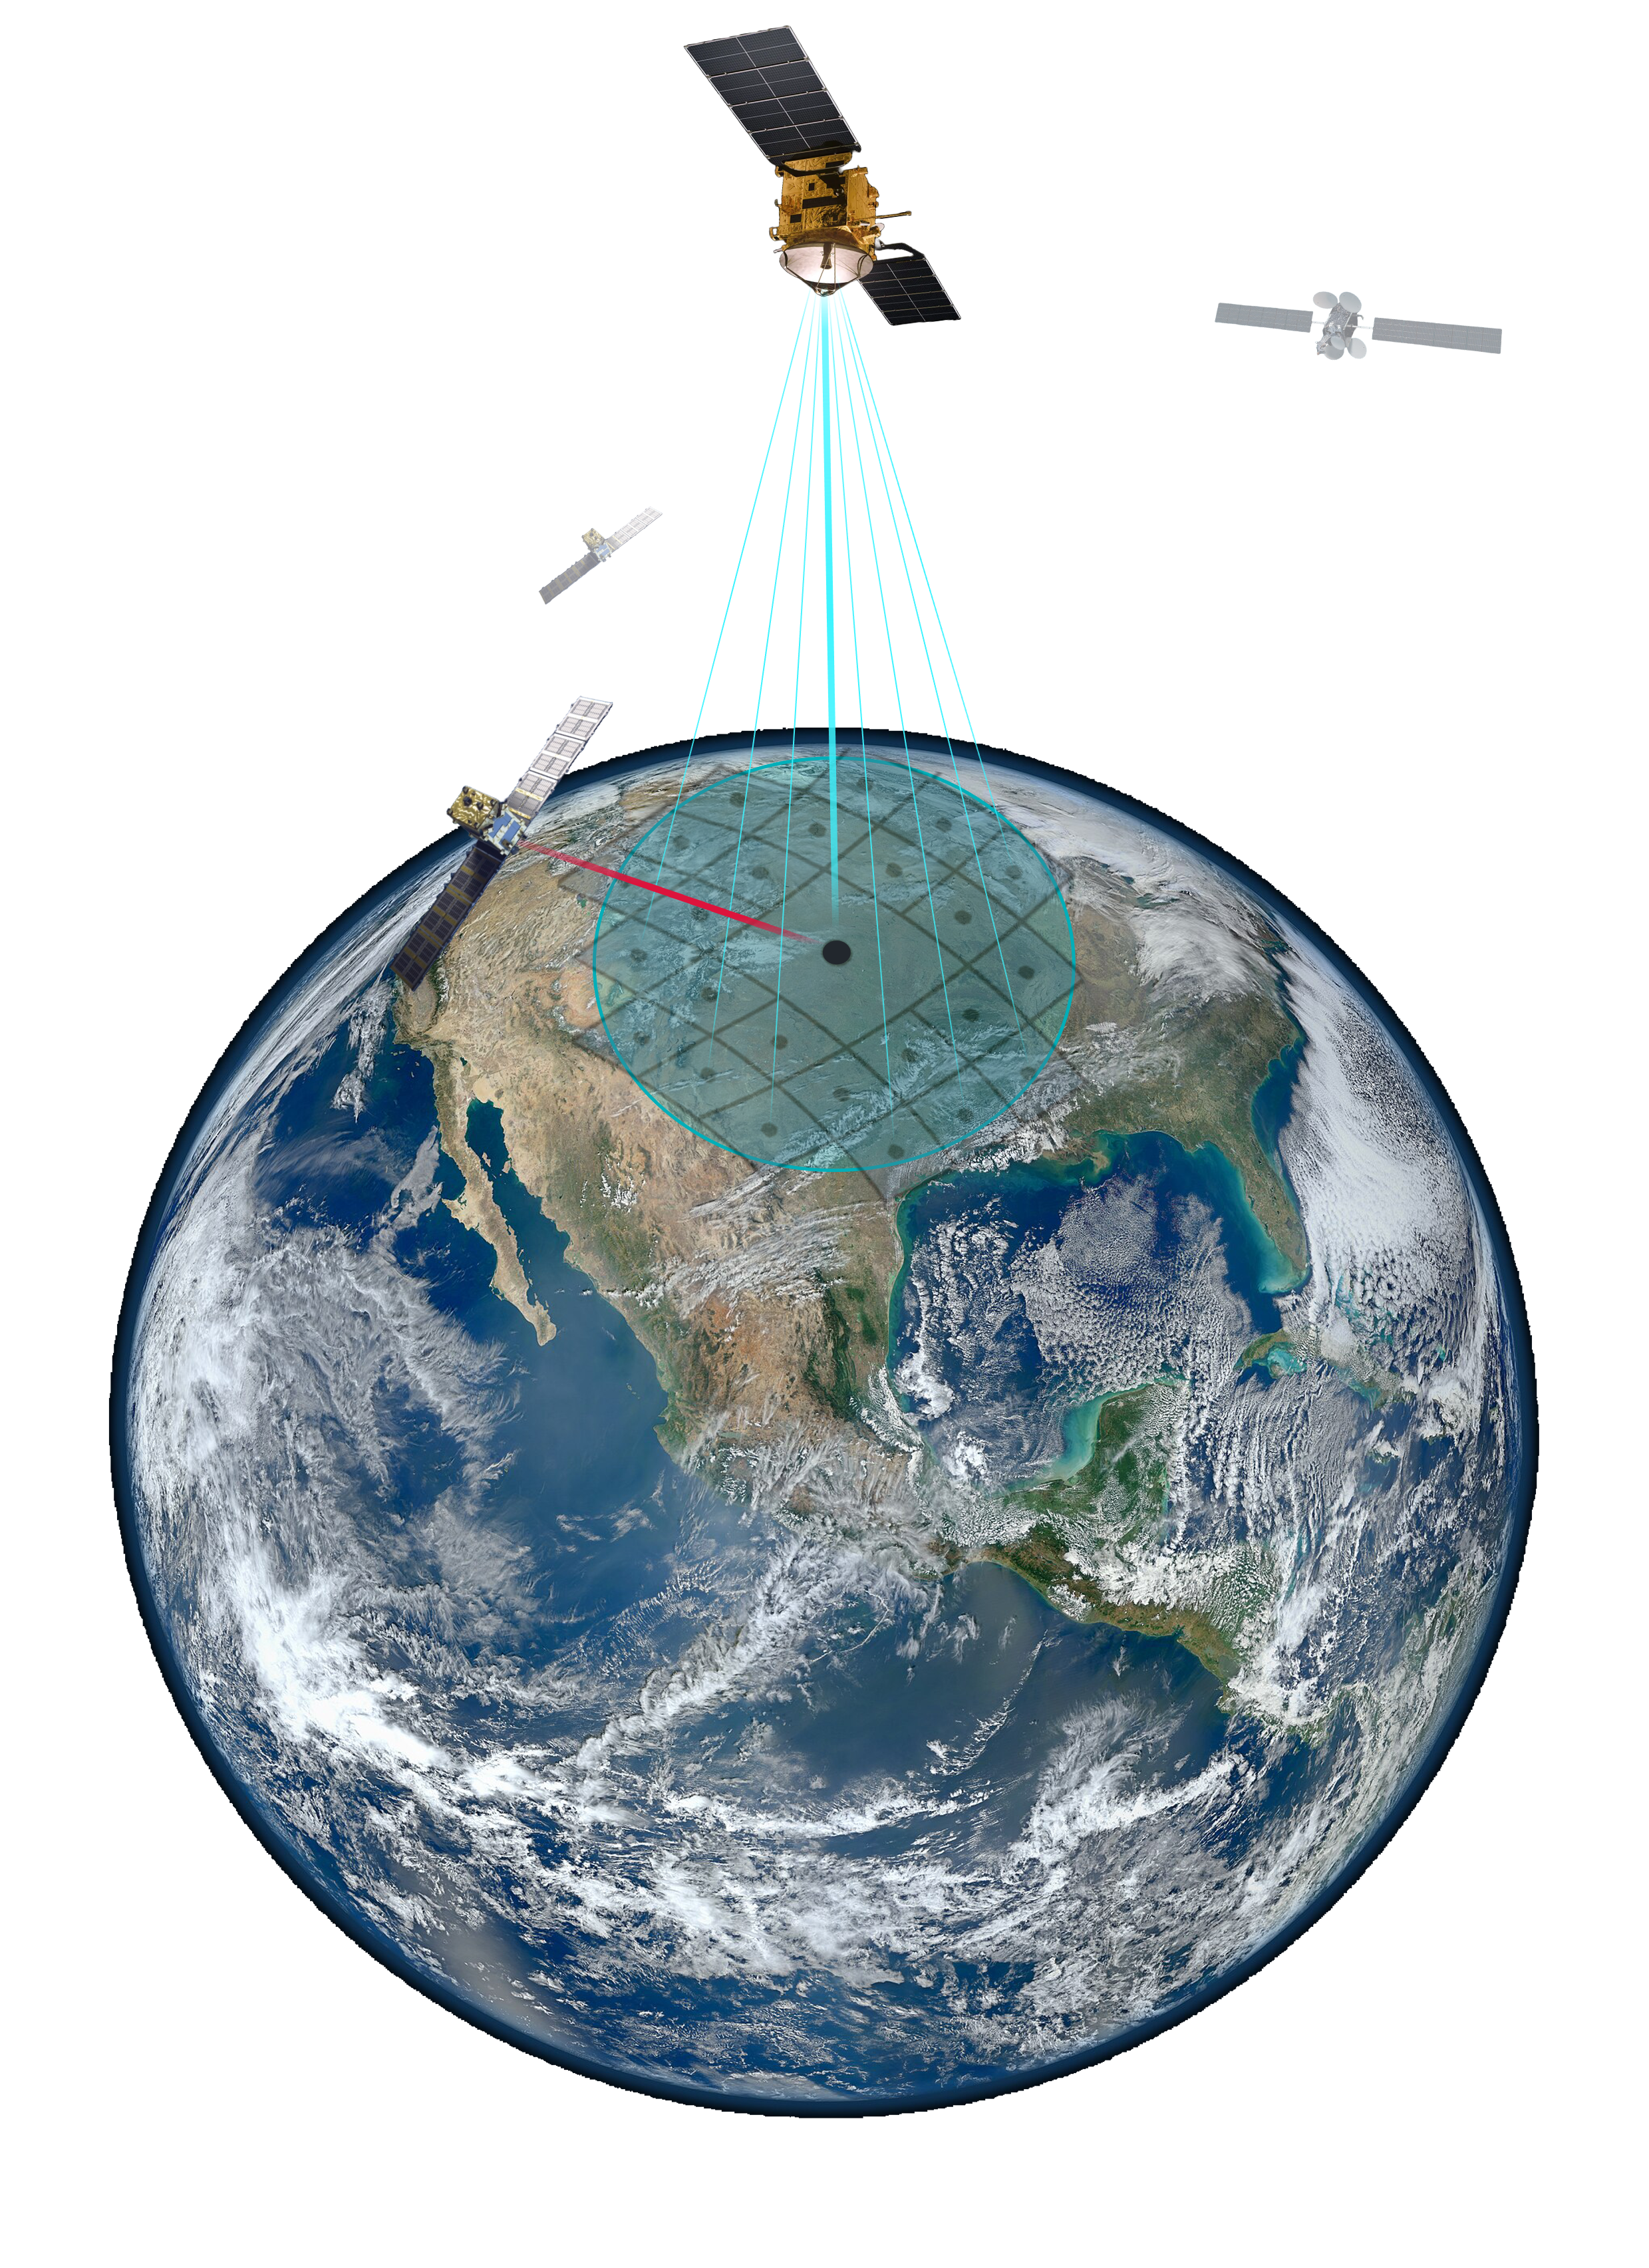
Step 4: Interference Event Detection
Interference occurs when two satellites with overlapping frequencies have overlapping view cones. For each timestep, we calculate your satellite's coverage footprint, each potential interferer's footprint at the same moment, and find the areas of intersection.
Step 5: Filtered Aggregation
Millions of interference matrices (epoch x interfering satellite) are combined per operating band (e.g., S-band, Ka-band). The aggregated Compressed Sparse Matrix (CSM) data is stored and accessible via the web app or API until replaced by the next day's forecast.
Getting Started
Simple Integration
- Select satellites from your constellation to track through our web app or API
- Receive daily forecasts of the congestion score per frequency band for your satellite's coverage area
- Validate correlation against your link performance
Production Integration
Provide your system parameters—beam geometry, antenna patterns, EIRP, bandwidth, polarization, G/T, modulation, and measured Eb/N₀ or noise floor telemetry—and receive calibrated outputs including ΔC/I, ΔEb/N₀, and expected link margin degradation.
Telemetry feedback calibrates our models to your specific system—rapidly improving accuracy and enabling pattern-of-life characterization for third-party satellites.
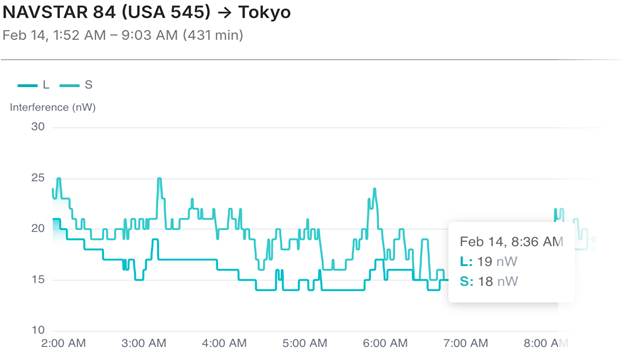
Visualization and Alerts
Vega transforms raw interference data into actionable intelligence:
- Heatmaps — See interference intensity across Earth's surface in real-time
- Time-Series Charts — Track interference levels over multi-day windows or specific ground station passes
- Alert Thresholds — Get notified when interference exceeds predefined levels
Validation and Accuracy
- TLE Freshness — Orbital data is refreshed daily; predictions degrade beyond 7 days
- Confidence Scoring — Frequency mappings are tagged with confidence levels based on data source quality
- Known Limitations — We're transparent about what we can't predict (solar storms, unannounced satellite maneuvers, intentional jamming)
Learn More
One-Page Overview (PDF) · Technical Document (PDF) · Contact Us